


Technical analysis is a method used to evaluate and forecast the future price movements of financial assets by analyzing historical price data and trading volumes. Unlike fundamental analysis, which focuses on the intrinsic value of an asset based on economic indicators, earnings reports, and other qualitative factors, technical analysis relies solely on price charts and market behavior. The underlying premise of technical analysis is that all relevant information is already reflected in the price, and that price movements tend to follow certain patterns over time.
This approach is widely used by traders and investors to make informed decisions about buying and selling assets. At its core, technical analysis operates on the belief that market psychology plays a significant role in price movements. Traders often react similarly to certain market conditions, leading to predictable patterns.
For instance, during a bullish market, traders may exhibit optimism, driving prices higher, while in a bearish market, fear may lead to selling pressure.
This method can be applied across various financial markets, including stocks, commodities, forex, and cryptocurrencies, making it a versatile tool for traders.
Key Technical Analysis Tools
Price Charts: A Visual Representation of Market Data
One of the most fundamental tools in technical analysis is the price chart, which provides a visual representation of an asset’s price movements over time. There are various types of charts, including line charts, bar charts, and candlestick charts.
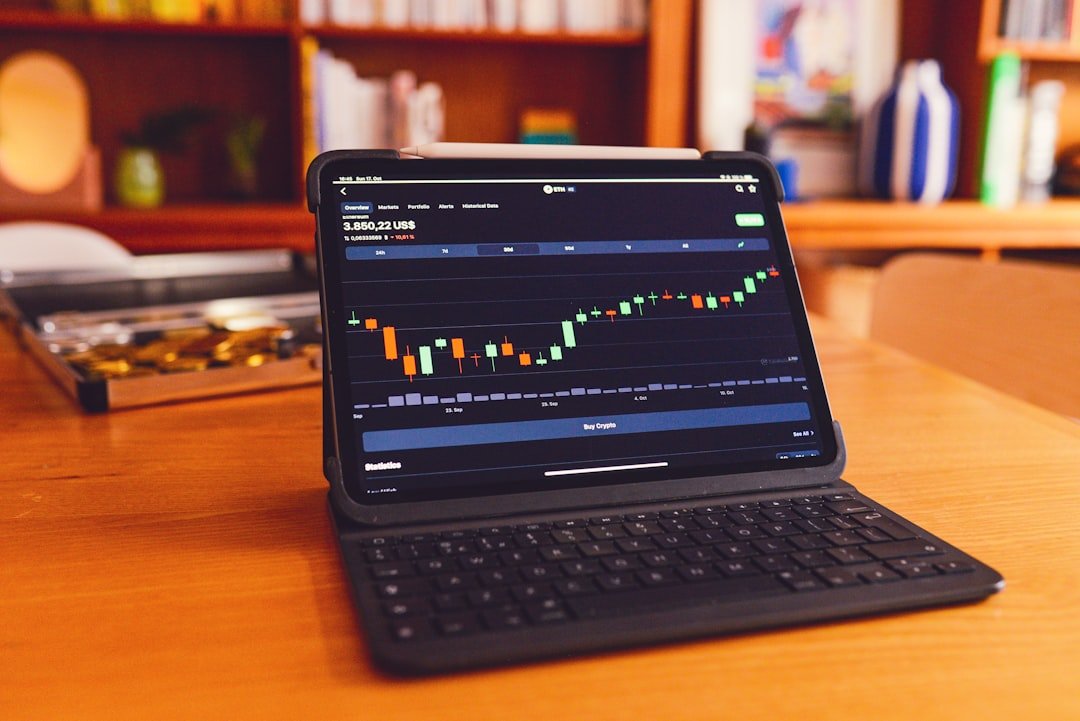
Candlestick Charts: A Detailed Look at Market Trends
Candlestick charts are particularly useful, as they convey more information at a glance, including opening and closing prices, as well as highs and lows within a specific time frame. This detailed information enables traders to gain a deeper understanding of market trends and patterns.
Indicators: Mathematical Calculations for Identifying Trends
In addition to price charts, indicators play a crucial role in technical analysis. These mathematical calculations are derived from price and volume data and are plotted on charts to help traders identify trends and potential reversals. Common indicators include the Relative Strength Index (RSI), Moving Average Convergence Divergence (MACD), and Bollinger Bands. Each of these indicators provides insights into market momentum, volatility, and potential overbought or oversold conditions. By combining these tools with price charts, traders can develop a more comprehensive understanding of market dynamics.
Identifying Trends and Patterns
Identifying trends is a cornerstone of technical analysis. A trend refers to the general direction in which an asset’s price is moving over a specific period. Trends can be classified as upward (bullish), downward (bearish), or sideways (neutral).
Recognizing these trends allows traders to align their strategies with the prevailing market sentiment. For example, in an upward trend, traders may look for opportunities to buy on dips, while in a downward trend, they might consider short-selling or waiting for signs of reversal. Patterns also play a significant role in technical analysis.
These formations can indicate potential future price movements based on historical behavior. Common patterns include head and shoulders, double tops and bottoms, triangles, and flags. Each pattern has its own implications; for instance, a head and shoulders pattern typically signals a reversal from bullish to bearish sentiment.
Conversely, a double bottom pattern often indicates a potential reversal from bearish to bullish. By studying these patterns in conjunction with volume data, traders can enhance their predictive capabilities and make more informed trading decisions.
Support and Resistance Levels
Support and resistance levels are critical concepts in technical analysis that help traders identify potential price points where an asset may reverse direction. Support refers to a price level at which buying interest is strong enough to overcome selling pressure, preventing the price from falling further. Conversely, resistance is a price level where selling interest is strong enough to overcome buying pressure, preventing the price from rising further.
These levels are not fixed; they can change over time as market conditions evolve. Traders often use historical price data to identify these levels. For example, if an asset has repeatedly bounced off a certain price level in the past, that level may be considered strong support.
Similarly, if an asset has struggled to break above a specific price point multiple times, that point may be viewed as resistance.
Additionally, when prices break through established support or resistance levels, it can signal significant shifts in market sentiment and lead to increased volatility.
Moving Averages and Oscillators
Moving averages are one of the most widely used tools in technical analysis for smoothing out price data over a specified period. They help traders identify trends by filtering out short-term fluctuations and providing a clearer picture of the overall direction of an asset’s price movement. The two most common types of moving averages are the simple moving average (SMA) and the exponential moving average (EMA).
The SMA calculates the average price over a specific number of periods, while the EMA gives more weight to recent prices, making it more responsive to current market conditions. Oscillators are another category of technical indicators that help traders assess momentum and potential reversals in price trends. Unlike moving averages that provide trend direction, oscillators fluctuate between defined ranges and can indicate overbought or oversold conditions.
The Relative Strength Index (RSI) is one of the most popular oscillators; it ranges from 0 to 100 and is typically used to identify potential reversal points when it reaches extreme levels (above 70 for overbought conditions and below 30 for oversold conditions). By combining moving averages with oscillators, traders can create more robust trading strategies that account for both trend direction and momentum.
Fibonacci Retracement and Extension
Fibonacci retracement is a powerful tool used by technical analysts to identify potential reversal levels based on the Fibonacci sequence—a mathematical series where each number is the sum of the two preceding ones. In trading, Fibonacci retracement levels are drawn by taking key high and low points on a chart and dividing the vertical distance by key Fibonacci ratios: 23.6%, 38.2%, 50%, 61.8%, and 100%. These levels often act as support or resistance during pullbacks in trending markets.
Fibonacci extension levels serve a similar purpose but are used to project potential future price targets beyond the current trend’s high or low. Traders often use these extensions to set profit targets after entering trades based on retracement levels. For instance, if an asset retraces to the 61.8% level before continuing its upward trend, traders might look at the 161.8% extension level as a potential target for taking profits.
The psychological significance of Fibonacci levels often leads to increased trading activity around these points, making them valuable for traders seeking to capitalize on market movements.
Using Technical Analysis in Forex Trading
In the realm of forex trading, technical analysis is particularly valuable due to the high liquidity and volatility of currency pairs. Traders often rely on technical indicators to make quick decisions in fast-moving markets where fundamental factors may not provide timely insights. For instance, during major economic announcements or geopolitical events, currency prices can fluctuate dramatically within short time frames.
In such scenarios, technical analysis allows traders to identify key support and resistance levels quickly. Moreover, forex markets operate 24 hours a day across different time zones, making it essential for traders to utilize various time frames when conducting technical analysis. Day traders may focus on shorter time frames like 5-minute or 15-minute charts to capture quick price movements, while swing traders might analyze daily or weekly charts for broader trends.
By employing tools such as moving averages and oscillators across different time frames, forex traders can develop strategies that align with their risk tolerance and trading style.
Applying Technical Analysis to Cryptocurrency Trading
The cryptocurrency market has gained immense popularity in recent years due to its rapid growth and volatility. Technical analysis has become an essential tool for cryptocurrency traders looking to navigate this dynamic landscape effectively. Given that cryptocurrencies often experience significant price swings within short periods, technical analysis provides insights into potential entry and exit points based on historical price behavior.
One unique aspect of cryptocurrency trading is the prevalence of various chart patterns that may not be as common in traditional markets. For example, cryptocurrencies often exhibit parabolic moves followed by sharp corrections—phenomena that can be analyzed using technical tools like Bollinger Bands or RSI to gauge overbought conditions. Additionally, many cryptocurrencies have relatively low trading volumes compared to traditional assets; thus, understanding support and resistance levels becomes even more critical as they can lead to rapid price changes when breached.
In conclusion, technical analysis serves as an invaluable framework for traders across various financial markets—be it forex or cryptocurrency—by providing tools and methodologies for interpreting price movements and making informed trading decisions based on historical data patterns.