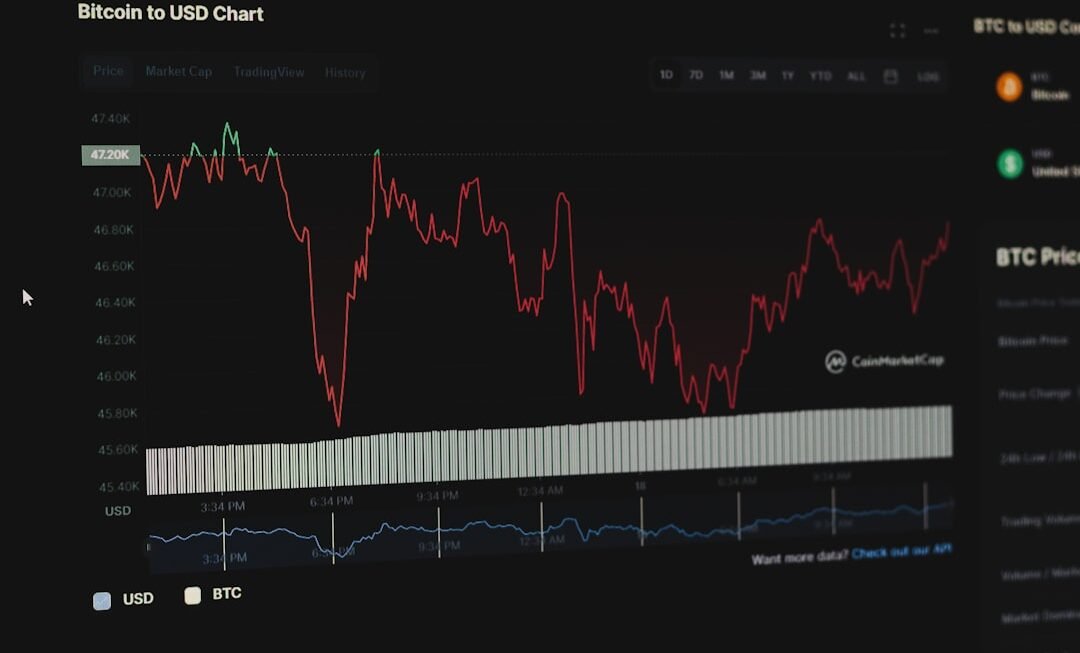
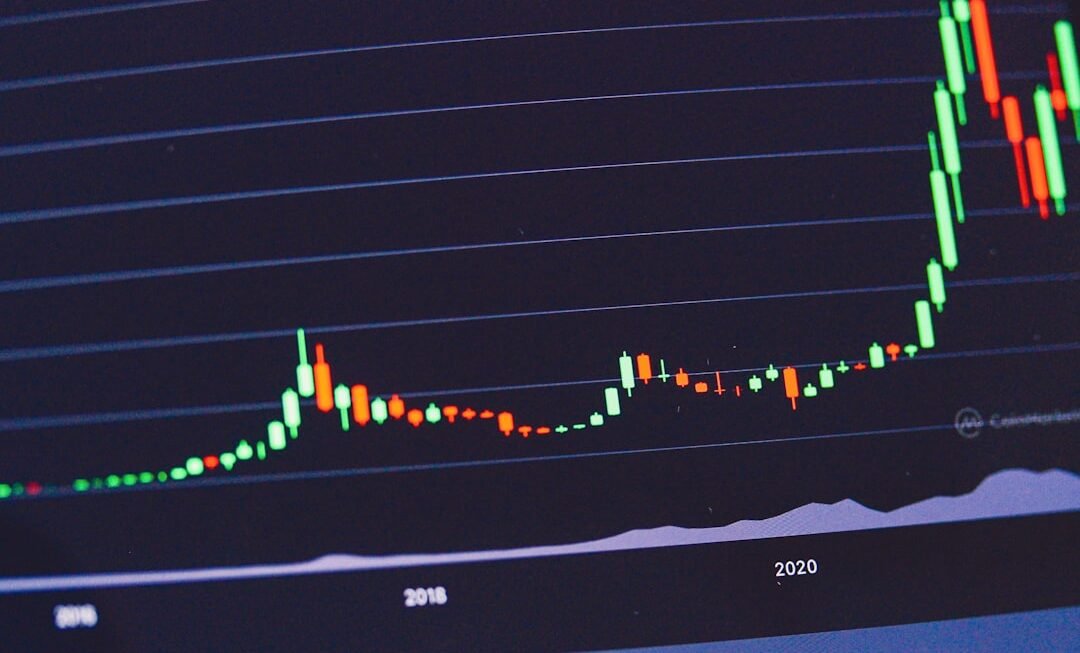
Technical analysis is a method for evaluating and forecasting future price movements of financial assets, including cryptocurrencies, based on historical price data and trading volume. This approach assumes that historical price patterns tend to repeat and that market trends can be identified and utilized for profitable trading decisions. Charts are fundamental to technical analysis, serving as visual representations of price data.
Common chart types include line charts, bar charts, and candlestick charts. Traders analyze these charts to identify patterns, trends, and potential market reversal points. Technical analysis also employs various indicators and tools, such as moving averages, oscillators, and support and resistance levels, to further analyze and interpret price data.
Trading volume is another crucial factor in technical analysis. Volume represents the number of units of a cryptocurrency traded within a specific timeframe and can provide insights into the strength or weakness of price movements. By understanding and applying technical analysis principles, traders can gain a deeper comprehension of market dynamics and make more informed trading decisions.
Choosing the Right Technical Analysis Tools for Cryptocurrency Trading
Identifying Trends with Moving Averages
One popular technical analysis tool for cryptocurrency trading is moving averages. Moving averages are used to smooth out price data and identify trends over a specific period of time. Traders can use moving averages to identify potential entry and exit points in the market and to confirm the strength of a trend.
Detecting Market Extremes with Oscillators
Another commonly used tool is oscillators, which are used to identify overbought or oversold conditions in the market. Oscillators can help traders identify potential reversal points and make more informed trading decisions.
Utilizing Support and Resistance Levels
In addition to moving averages and oscillators, traders also utilize support and resistance levels in their analysis. Support levels are price levels where a cryptocurrency tends to find buying interest, while resistance levels are price levels where selling interest tends to emerge. By identifying these levels on a chart, traders can anticipate potential price movements and set appropriate entry and exit points for their trades. By choosing the right technical analysis tools for cryptocurrency trading, traders can gain valuable insights into market trends and make more informed trading decisions.
Utilizing Candlestick Patterns for Cryptocurrency Analysis
Candlestick patterns are a popular tool used in technical analysis to identify potential trend reversals and continuation patterns in the market. These patterns are formed by the open, high, low, and close prices of a cryptocurrency over a specific period of time and can provide valuable insights into market sentiment and potential price movements. One common candlestick pattern is the “doji,” which is formed when the open and close prices are nearly equal.
A doji pattern indicates indecision in the market and can signal a potential reversal in the current trend. Another popular pattern is the “engulfing pattern,” which consists of two candles where the second candle “engulfs” the body of the first candle. This pattern can indicate a potential reversal in the market sentiment and is often used by traders to identify entry and exit points for their trades.
In addition to these patterns, there are numerous other candlestick patterns that traders can use to analyze cryptocurrency price movements. By understanding these patterns and how they can be used to interpret market sentiment, traders can gain valuable insights into potential price movements and make more informed trading decisions.
Using Moving Averages and Oscillators for Cryptocurrency Trading
Moving averages and oscillators are two popular technical analysis tools used by cryptocurrency traders to identify trends and potential reversal points in the market. Moving averages are used to smooth out price data and identify trends over a specific period of time, while oscillators are used to identify overbought or oversold conditions in the market. One common type of moving average is the simple moving average (SMA), which calculates the average price of a cryptocurrency over a specific number of periods.
Traders use SMAs to identify potential entry and exit points in the market and to confirm the strength of a trend. Another type of moving average is the exponential moving average (EMA), which gives more weight to recent price data. EMAs are often used by traders to identify short-term trends in the market and to make more informed trading decisions.
Oscillators, on the other hand, are used to identify overbought or oversold conditions in the market. One popular oscillator is the relative strength index (RSI), which measures the speed and change of price movements. Traders use the RSI to identify potential reversal points in the market and to make more informed trading decisions.
By using moving averages and oscillators in their analysis, cryptocurrency traders can gain valuable insights into market trends and potential price movements.
Implementing Support and Resistance Levels in Cryptocurrency Analysis
Support and resistance levels are important concepts in technical analysis that are used by cryptocurrency traders to identify potential price movements and set appropriate entry and exit points for their trades. Support levels are price levels where a cryptocurrency tends to find buying interest, while resistance levels are price levels where selling interest tends to emerge. Traders use support and resistance levels to anticipate potential price movements in the market and to set appropriate stop-loss and take-profit levels for their trades.
By identifying these levels on a chart, traders can gain valuable insights into potential price movements and make more informed trading decisions. Support and resistance levels can also be used in conjunction with other technical analysis tools, such as moving averages and oscillators, to confirm potential entry and exit points in the market. In addition to identifying support and resistance levels on a chart, traders also pay attention to how these levels are tested by price movements.
If a support or resistance level is tested multiple times without being broken, it is considered stronger, while if it is broken, it can indicate a potential trend reversal in the market. By implementing support and resistance levels in their analysis, cryptocurrency traders can gain valuable insights into potential price movements and make more informed trading decisions.
Incorporating Volume Analysis in Cryptocurrency Trading
Understanding Volume in Cryptocurrency Markets
Volume analysis is a crucial aspect of technical analysis used by cryptocurrency traders to assess the strength or weakness of a price movement. Volume refers to the number of units of a cryptocurrency traded over a specific period of time, providing valuable insights into market dynamics.
Interpreting Volume Indicators
Traders use volume analysis to confirm potential trend reversals or continuations in the market. For instance, a significant increase in price accompanied by high trading volume can indicate strong buying interest, while a significant decrease in price accompanied by high trading volume can indicate strong selling interest. Additionally, volume analysis can help identify potential entry and exit points for trades.
Integrating Volume Analysis with Other Technical Indicators
Traders pay close attention to how volume reacts at key support and resistance levels, as well as how it confirms or contradicts other technical indicators such as moving averages and oscillators. By incorporating volume analysis into their trading strategy, cryptocurrency traders can gain a deeper understanding of market dynamics and make more informed trading decisions.
Combining Multiple Technical Analysis Tools for Effective Cryptocurrency Trading
While each technical analysis tool has its own strengths and weaknesses, combining multiple tools can provide a more comprehensive view of market dynamics and help traders make more informed trading decisions. By using a combination of tools such as moving averages, oscillators, support and resistance levels, candlestick patterns, and volume analysis, cryptocurrency traders can gain valuable insights into potential price movements and market trends. For example, traders can use moving averages to identify trends in the market, oscillators to identify overbought or oversold conditions, support and resistance levels to set appropriate entry and exit points for their trades, candlestick patterns to identify potential trend reversals or continuations, and volume analysis to confirm potential price movements.
By combining these tools in their analysis, traders can gain a more comprehensive understanding of market dynamics and make more informed trading decisions. It’s important for traders to understand that no single technical analysis tool can provide all the answers when it comes to predicting future price movements. By combining multiple tools in their analysis, traders can gain a more comprehensive view of market dynamics and increase their chances of making profitable trading decisions.
Additionally, it’s important for traders to continuously educate themselves on new tools and techniques as the cryptocurrency market evolves over time. By staying informed and adaptable, traders can continue to refine their technical analysis skills and improve their trading performance in the cryptocurrency market.


