Breakout strategies are pivotal in the realm of trading, particularly for those who seek to capitalize on significant price movements. At their core, these strategies involve identifying key levels of support and resistance, where the price has historically struggled to break through. When the price finally breaches these levels, it often signals a potential shift in market sentiment, leading to substantial price movements.
Traders who employ breakout strategies aim to enter positions just as the price breaks out of these established ranges, anticipating that momentum will carry the price further in the direction of the breakout.
For instance, if a stock has been trading within a narrow range for an extended period, a breakout above resistance could indicate a surge in buying interest.
Conversely, a breakdown below support might suggest increased selling pressure. Successful breakout traders often look for confirmation through volume spikes or other indicators that validate the breakout.
Identifying Market Momentum
Market momentum is a critical component in the execution of breakout strategies. It refers to the strength or speed of price movements and is often assessed through various analytical methods. Traders typically look for signs of increasing momentum as a precursor to potential breakouts.
For example, if a stock’s price is rising steadily with increasing volume, it may indicate strong buying interest, suggesting that a breakout could be imminent. Conversely, if prices are rising but volume is declining, it may signal weakening momentum and caution against entering a position. To effectively identify market momentum, traders often utilize tools such as moving averages and momentum oscillators.
Moving averages smooth out price data over a specified period, allowing traders to visualize trends more clearly. A common strategy is to observe crossovers between short-term and long-term moving averages; when a short-term average crosses above a long-term average, it can signal bullish momentum. Similarly, momentum oscillators like the Relative Strength Index (RSI) or the Moving Average Convergence Divergence (MACD) provide insights into whether an asset is overbought or oversold, helping traders gauge the strength of current price movements.
Setting Entry and Exit Points
Establishing precise entry and exit points is crucial for maximizing profits and minimizing losses in breakout trading. Entry points are typically set just above resistance levels for bullish breakouts or just below support levels for bearish breakouts. This strategic positioning allows traders to capitalize on the initial surge following a breakout while also providing a buffer against false breakouts.
For instance, if a stock has consistently faced resistance at $50, a trader might set an entry point at $50.50, ensuring they enter the trade only after confirming that the breakout has occurred. Exit points are equally important and can be determined using various methods. One common approach is to set profit targets based on previous price action or volatility measures.
For example, if a stock has historically moved $5 after breaking out from resistance, a trader might set their profit target at $55 following a breakout at $50. Additionally, employing trailing stops can help lock in profits as the price moves favorably while allowing for some flexibility in case of minor pullbacks. This dynamic approach to setting exit points ensures that traders can adapt to changing market conditions while still adhering to their overall trading strategy.
Utilizing Technical Indicators
Technical indicators play an essential role in enhancing the effectiveness of breakout strategies. These indicators provide traders with quantitative data that can help confirm breakouts and assess market conditions. Among the most widely used indicators are volume indicators, trend indicators, and volatility indicators.
Volume indicators, such as On-Balance Volume (OBV) or Chaikin Money Flow (CMF), help traders gauge whether the breakout is supported by strong buying or selling pressure. A breakout accompanied by high volume is generally considered more reliable than one with low volume. Trend indicators like the Average Directional Index (ADX) can also be instrumental in breakout trading.
The ADX measures the strength of a trend without indicating its direction; thus, it can help traders determine whether the market is trending strongly enough to warrant a breakout strategy. A rising ADX above 20 often signals that a strong trend is developing, making it an opportune time for traders to consider entering positions based on breakout signals. Additionally, volatility indicators such as Bollinger Bands can provide insights into potential breakouts by highlighting periods of low volatility that may precede significant price movements.
Managing Risk and Position Sizing
Effective risk management is paramount in trading, particularly when employing breakout strategies that can be susceptible to false breakouts. One of the fundamental principles of risk management is determining position size based on individual risk tolerance and account size. Traders often use a fixed percentage of their trading capital—commonly 1-2%—to determine how much they are willing to risk on any single trade.
This approach ensures that even in the event of multiple losses, traders can continue to operate without depleting their capital. Stop-loss orders are another critical component of risk management in breakout trading. Placing stop-loss orders just below support levels for long positions or above resistance levels for short positions can help mitigate losses in case of adverse price movements.
For example, if a trader enters a long position after a breakout at $50.50, they might place a stop-loss order at $49.50 to limit potential losses should the price reverse unexpectedly. This disciplined approach not only protects capital but also instills a sense of confidence in executing trades without emotional interference.
Backtesting and Analyzing Performance
Evaluating Strategy Performance
Through backtesting, traders can simulate trades based on past price movements and assess key metrics such as win rate, average profit per trade, and maximum drawdown. This analysis provides valuable insights into the strengths and weaknesses of a strategy, enabling traders to make informed decisions about its application.
Identifying Weaknesses and Refining Strategies
Backtesting also enables traders to identify potential weaknesses in their strategies and make necessary adjustments before risking real capital. For instance, if backtesting reveals that a particular indicator consistently leads to false breakouts during specific market conditions, such as high volatility, traders can modify their approach accordingly.
Enhancing Strategy Robustness and Market Understanding
This iterative process not only enhances strategy robustness but also fosters a deeper understanding of market dynamics and how different factors influence price movements. By refining their strategies through backtesting, traders can develop a more nuanced understanding of the markets, ultimately leading to more informed trading decisions.
Adapting to Changing Market Conditions
The financial markets are inherently dynamic, influenced by various factors such as economic data releases, geopolitical events, and shifts in investor sentiment. As such, successful traders must remain adaptable and responsive to changing market conditions when implementing breakout strategies. For instance, during periods of heightened volatility—often triggered by major news events—breakout levels may become less reliable due to increased price fluctuations and potential whipsaws.
Traders can enhance their adaptability by continuously monitoring market news and economic indicators that may impact their trading environment. Additionally, adjusting position sizes or employing different technical indicators based on current market conditions can help mitigate risks associated with unexpected price movements. For example, during times of low volatility, traders might opt for tighter stop-loss orders to protect against minor reversals while allowing for larger stop-losses during more volatile periods.
Implementing Breakout Strategies in Forex and Crypto Trading
Breakout strategies are not limited to traditional stock markets; they are equally applicable in Forex and cryptocurrency trading environments. In Forex trading, currency pairs often exhibit clear support and resistance levels influenced by economic data releases and geopolitical events. Traders can apply similar principles by identifying key levels on currency charts and entering positions when these levels are breached with sufficient momentum.
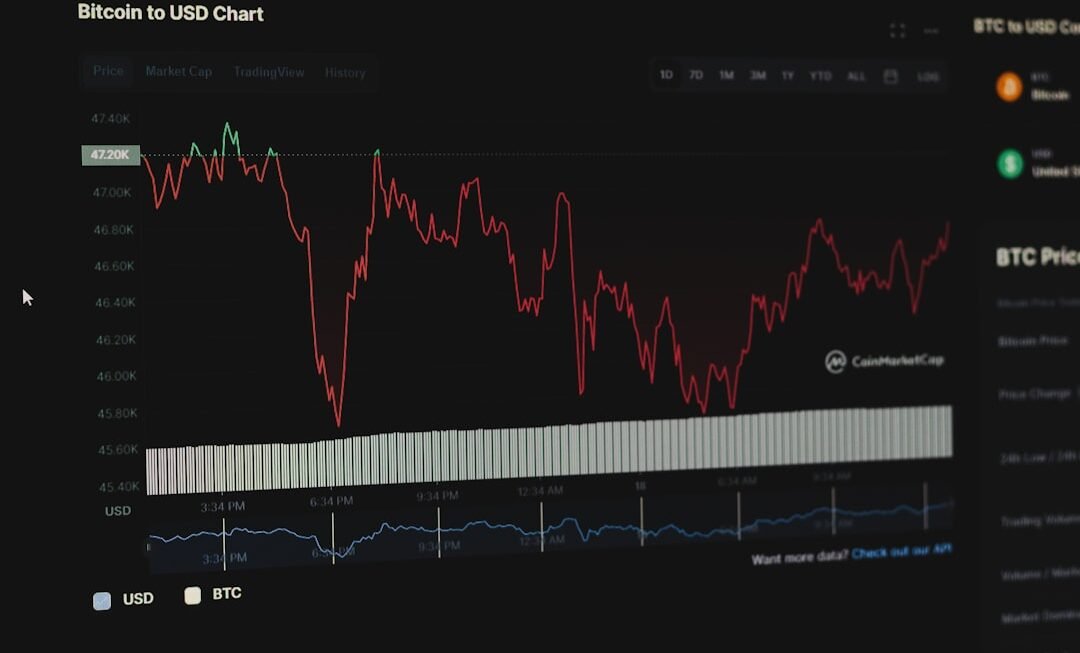
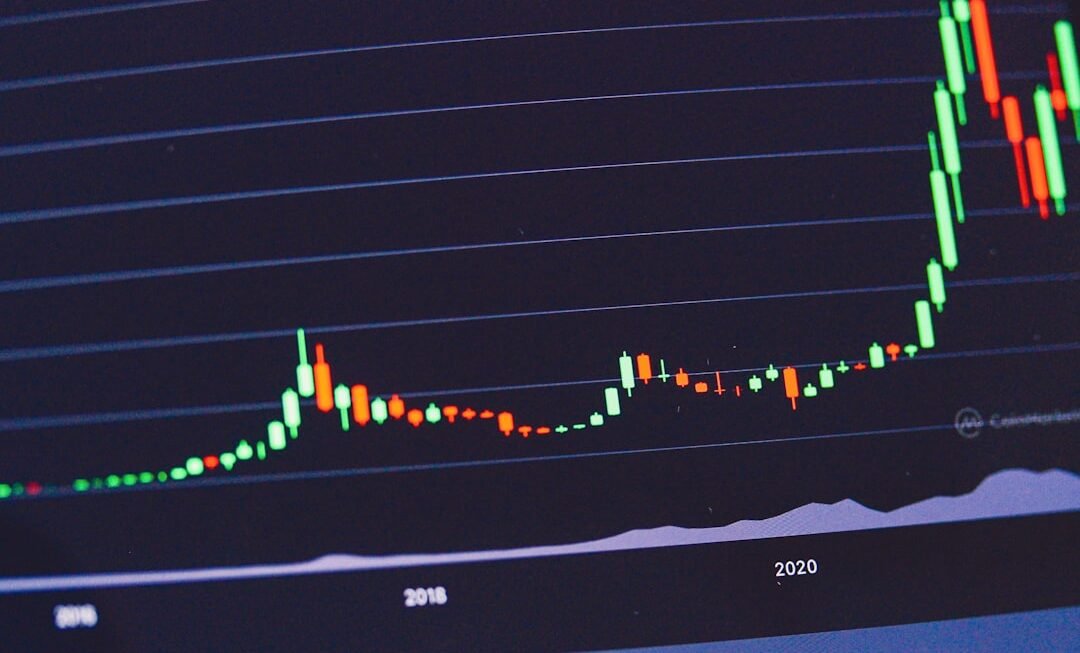
In cryptocurrency markets, where volatility is often pronounced, breakout strategies can be particularly effective due to rapid price movements driven by market sentiment and news cycles. For instance, if Bitcoin has been trading within a range between $30,000 and $35,000 for several weeks, a breakout above $35,000 could signal bullish sentiment among investors, prompting traders to enter long positions with appropriate risk management measures in place. In both Forex and crypto trading, utilizing technical indicators tailored to these markets can enhance the effectiveness of breakout strategies.
For example, incorporating volume analysis specific to cryptocurrency exchanges can provide insights into whether breakouts are supported by genuine buying interest or merely speculative activity. By adapting breakout strategies to suit the unique characteristics of Forex and cryptocurrency markets, traders can position themselves advantageously in pursuit of profitable opportunities amidst fluctuating market conditions.


